Multiple Choice
Here is the stem-and-leaf display of the midterm test scores for a high school typing class. 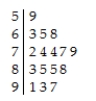
Would you use the median or the mean to describe the centre of this distribution?
A) Mean,because the data are quite symmetric.
B) Mean,because the data are skewed to the right.
C) Median,because the data are skewed to the left.
D) Mean,because the data are skewed to the left.
E) Median,because the data are skewed to the right.
Correct Answer:

Verified
Correct Answer:
Verified
Q10: A local ice cream shop hand scoops
Q40: A student at a local university took
Q41: Shown below are the boxplot,the histogram and
Q42: The boxplots display case prices (in dollars)of
Q43: The ages of the 21 members of
Q45: A business owner recorded her annual profits
Q46: The test scores of 15 students are
Q47: Here is a histogram of the assets
Q48: The back-to-back stem-and-leaf display compares the annual
Q49: In May 2011,17 coffee shops in Vancouver