Multiple Choice
A business owner recorded her annual profits for the first 12 years since opening her business in 1993.The stem-and-leaf display below shows the annual profits in thousands of dollars.Use both the stemplot and timeplot to describe the distribution. 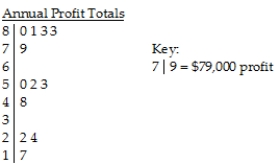
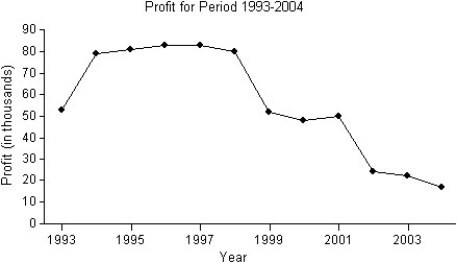
A) The distribution of the business owner's profits is skewed to the left,and is unimodal,with gaps in between.The centre is at around $50,000.The timeplot shows that the profits grew from 1993 to 1994,and were relatively steady from 1994 to 1998.After 1998,the profits declined significantly compared with those between 1993 and 1998.
B) The distribution of the business owner's profits is skewed to the left,and is multimodal,with gaps in between.One mode is at around $80,000,another at around $50,000,and a third mode at around $20,000.The timeplot shows that the profits grew from 1993 to 1994,and were relatively steady from 1994 to 2001.After 2001,the profits declined significantly compared with those between 1994 and 2001.
C) The distribution of the business owner's profits is skewed to the right,and is multimodal,with gaps in between.One mode is at around $80,000,another at around $50,000,and a third mode at around $20,000.The timeplot shows that the profits grew from 1993 to 1994,and were relatively steady from 1994 to 1998.After 1998,the profits declined significantly compared with those between 1993 and 1998.
D) The distribution of the business owner's profits is skewed to the left,and is multimodal,with gaps in between.One mode is at around $80,000,another at around $50,000,and a third mode at around $20,000.The timeplot shows that the profits grew from 1993 to 1994,and were relatively steady from 1994 to 1998.After 1998,the profits declined significantly compared with those between 1993 and 1998.
E) The distribution of the business owner's profits is skewed to the left,and is unimodal,with gaps in between.The centre is at around $50,000.The timeplot shows that the profits grew from 1993 to 1994,and were relatively steady from 1994 to 2001.After 2001,the profits declined significantly compared with those between 1994 and 2001.
Correct Answer:

Verified
Correct Answer:
Verified
Q40: A student at a local university took
Q41: Shown below are the boxplot,the histogram and
Q42: The boxplots display case prices (in dollars)of
Q43: The ages of the 21 members of
Q44: Here is the stem-and-leaf display of the
Q46: The test scores of 15 students are
Q47: Here is a histogram of the assets
Q48: The back-to-back stem-and-leaf display compares the annual
Q49: In May 2011,17 coffee shops in Vancouver
Q50: The times,in minutes,it took for 21 students