Multiple Choice
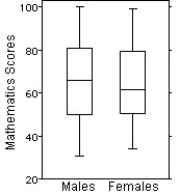
Here are the summary statistics for mathematics scores for one high-school graduating class. 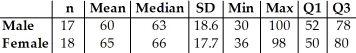
Choose the boxplot that represents the given data.
I II III 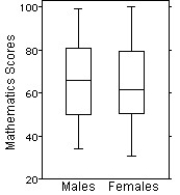

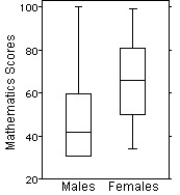
IV V 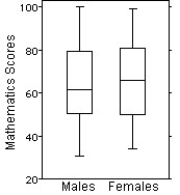
A) I
B) II
C) III
D) IV
E) V
Correct Answer:

Verified
Correct Answer:
Verified
Related Questions
Q29: How would you describe the shape of
Q62: Here is the stem-and-leaf display of the
Q63: Match each class with the corresponding boxplot
Q64: Here are summary statistics for the time,in
Q65: The weights (in kilograms)of 27 dogs are
Q67: Shown below are the data and summary
Q68: In a child psychology course,children took part
Q69: Here are boxplots of the points scored
Q70: The normal annual precipitation (in millimetres)is given
Q71: Office workers were asked how long it