Multiple Choice
The stem-and-leaf diagram shows the ages of 17 people at a playground in Halifax,Nova Scotia. 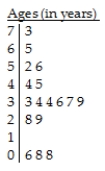
Key:
3 | 4 = 34 years
A) The distribution of the ages of people is skewed to the right,with a typical age between 28 and 73..There are 3 outliers,when a person's age is less than 10.
B) The distribution of the ages of people is skewed to the right,with a typical age between 33 and 39.
C) The distribution of the ages of people is skewed to the right,with a typical age between 33 and 39.With the exception of the 3 people with ages less than 10,the ages are between 28 and the maximum 73.
D) The distribution of the ages of people is skewed to the left,with a typical age between 33 and 39.With the exception of the 3 people with ages less than 10,the ages are between 28 and the maximum 73.
E) The distribution of the ages of people is skewed to the right,with a typical age between 44 and 56.With the exception of the 3 people with ages less than 10,the ages are between 28 and the maximum 73.
Correct Answer:

Verified
Correct Answer:
Verified
Q46: Which class had the highest median score?<br>A)Class
Q73: The heights,in centimetres,of 18 randomly selected Grade
Q74: Here are the test scores of 32
Q75: Here are the heights,in centimetres,of 32 Grade
Q76: The frequency table shows the weight ,in
Q79: Here is a histogram of the assets
Q80: Use the Olympic gold medal performances in
Q81: Here are some summary statistics for all
Q82: The mathematics department at a community college
Q83: The weekly salaries (in dollars)of 24 randomly