Essay
Use the Olympic gold medal performances in the men's high jump from the years 1960 - 1984 to construct a timeplot. 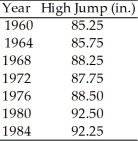
Correct Answer:

Verified
Correct Answer:
Verified
Related Questions
Q26: For class 2,compare the mean and the
Q46: Which class had the highest median score?<br>A)Class
Q75: Here are the heights,in centimetres,of 32 Grade
Q76: The frequency table shows the weight ,in
Q78: The stem-and-leaf diagram shows the ages of
Q79: Here is a histogram of the assets
Q81: Here are some summary statistics for all
Q82: The mathematics department at a community college
Q83: The weekly salaries (in dollars)of 24 randomly
Q84: Shown below are the boxplot and the