Multiple Choice
The mathematics department at a community college collected data for the number of students enrolled in 40 math courses over the course of one year.The following stem-and-leaf display shows the total number of students enrolled in each class. 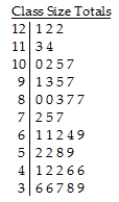
Key:
10 | 5 = 105 students
A) The distribution of the number of students enrolled in each of 40 math courses is nearly uniform.The smallest class size was 36 and the largest was 122.The centre of the distribution was around 88 students.
B) The distribution of the number of students enrolled in each of 40 math courses is skewed to the left,with a typical class size of 88 students.The smallest class size was 36 and the largest was 122.
C) The distribution of the number of students enrolled in each of 40 math courses is unimodal and symmetric.The smallest class size was 36 and the largest was 122.The centre of the distribution was around 75 students.
D) The distribution of the number of students enrolled in each of 40 math courses is skewed to the right,with a typical class size of 69 students.The smallest class size was 36 and the largest was 122.
E) The distribution of the number of students enrolled in each of 40 math courses is nearly uniform.The smallest class size was 36 and the largest was 122.The centre of the distribution was around 75 students.
Correct Answer:

Verified
Correct Answer:
Verified
Q26: For class 2,compare the mean and the
Q46: Which class had the highest median score?<br>A)Class
Q78: The stem-and-leaf diagram shows the ages of
Q79: Here is a histogram of the assets
Q80: Use the Olympic gold medal performances in
Q81: Here are some summary statistics for all
Q83: The weekly salaries (in dollars)of 24 randomly
Q84: Shown below are the boxplot and the
Q86: Here is a histogram of the assets
Q87: The boxplots display case prices (in dollars)of