Multiple Choice
The following stem-and-leaf display shows the number of homeless cats and dogs that had to be euthanized each year in a large city for the period 1985-2004. 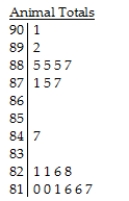
Key:
87 | 5 = 87,500 cats and dogs euthanized
A) The distribution of the number of cats and dogs that were euthanized is skewed to the right,with a centre at around 85,500.The number of cats and dogs euthanized each year ranges from 81,000 to 90,100.
B) The distribution of the number of cats and dogs that were euthanized is bimodal.The upper cluster is between 89,000 and 90,000 euthanized,with a centre at around 89,500.The lower cluster is between 81,000 and 82,000 euthanized,with a centre at around 81,000.
C) The distribution of the number of cats and dogs that were euthanized is skewed to the right,and has several modes,with gaps in between.One mode is clustered between 87,000 and 90,000 euthanized,a second mode at 84,000,and a third mode with a cluster between 81,000 and 82,000.
D) The distribution of the number of cats and dogs that were euthanized is unimodal,ranging from 81,000 to 90,100 euthanized.The centre of the distribution is at around 85,500.
E) The distribution of the number of cats and dogs that were euthanized is bimodal.The upper cluster is between 87,000 and 90,000 euthanized,with a centre at around 88,500.The lower cluster is between 81,000 and 82,000 euthanized,with a centre at around 81,000.
Correct Answer:

Verified
Correct Answer:
Verified
Q14: The boxplots display case prices (in dollars)of
Q15: Shown below are the boxplot,the histogram and
Q17: Here are summary statistics for the time,in
Q20: A business owner recorded her annual profits
Q21: The weights (in pounds)of 30 newborn babies
Q22: Here are some summary statistics for all
Q23: The following stem-and-leaf display shows the number
Q24: The weekly salaries (in dollars)of 24 randomly
Q32: Which class had the highest mean score?<br>A)Class
Q96: The speed vehicles travelled on a local