Multiple Choice
Shown below are the boxplot,the histogram and summary statistics for the weekly salaries (in dollars) of 24 randomly selected employees of a company: 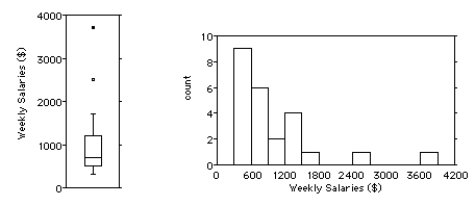

Write a few sentences describing the distribution.
A) The distribution is unimodal and skewed to the right.As shown in the boxplot,there are two outliers,weekly salaries of $2500 and about $3700.The median was 978.8,while the mean was 705,above the median score.The middle 50% of the weekly salaries were between $510 and $1225 for an IQR of $715.
B) The distribution is bimodal and skewed to the right.As shown in the boxplot,there are two outliers,weekly salaries of $2500 and about $3700.The median was 705,while the mean was 978.8,above the median score.The middle 50% of the weekly salaries were between $705 and $1225 for an IQR of $520.
C) The distribution is unimodal and skewed to the left.As shown in the boxplot,there are two outliers,weekly salaries of $2500 and about $3700.The median was 705,while the mean was 978.8,above the median score.The middle 50% of the weekly salaries were between $705 and $1225 for an IQR of $520.
D) The distribution is unimodal and skewed to the right.As shown in the boxplot,there are two outliers,weekly salaries of $2500 and about $3700.The median was 705,while the mean was 978.8,above the median score.The middle 50% of the weekly salaries were between $510 and $1225 for an IQR of $715.
E) The distribution is unimodal and skewed to the left.As shown in the boxplot,there are two outliers,weekly salaries of $2500 and about $3700.The median was 705,while the mean was 978.8,above the median score.The middle 50% of the weekly salaries were between $510 and $1225 for an IQR of $715.
Correct Answer:

Verified
Correct Answer:
Verified
Q10: Here are the summary statistics for the
Q11: Office workers were asked how long it
Q12: The back-to-back stem-and-leaf display compares the percent
Q13: Here are summary statistics of the last
Q14: The boxplots display case prices (in dollars)of
Q17: Here are summary statistics for the time,in
Q19: The following stem-and-leaf display shows the number
Q20: A business owner recorded her annual profits
Q32: Which class had the highest mean score?<br>A)Class
Q96: The speed vehicles travelled on a local