Multiple Choice
The following stem-and-leaf display shows the number of homeless cats and dogs that had to be euthanized each year in a large city for the period 1985-2004.Use both the stemplot and timeplot to describe the distribution. 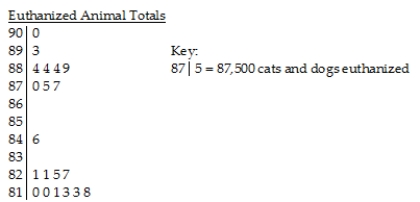
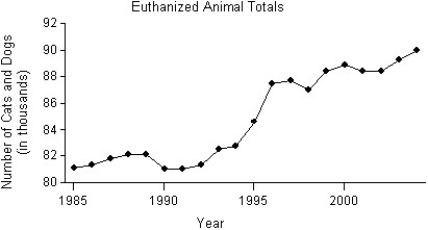
A) The distribution of the number of cats and dogs that were euthanized is skewed to the right,and has several modes,with gaps in between.One mode is clustered between 87,000 and 90,000 euthanized,a second mode at 84,000,and a third mode with a cluster between 81,000 and 82,000.The timeplot shows that the number of animals euthanized has increased over the period 1985-2004,with a significant increase between 1994 and 1996.
B) The distribution of the number of cats and dogs that were euthanized is bimodal.The upper cluster is between 87,000 and 90,000 euthanized,with a centre at around 88,400.The lower cluster is between 81,000 and 82,000 euthanized,with a centre at around 81,000.The timeplot shows that the number of animals euthanized has decreased over the period 1985-2004,with a significant decrease between 1994 and 1996.
C) The distribution of the number of cats and dogs that were euthanized is bimodal.The upper cluster is between 87,000 and 90,000 euthanized,with a centre at around 88,400.The lower cluster is between 81,000 and 82,000 euthanized,with a centre at around 81,000.The timeplot shows that the number of animals euthanized has increased over the period 1985-2004,with a significant increase between 1994 and 1996.
D) The distribution of the number of cats and dogs that were euthanized is bimodal.The upper cluster is between 89,000 and 90,000 euthanized,with a centre at around 88,400.The lower cluster is between 81,000 and 82,000 euthanized,with a centre at around 81,000.The timeplot shows that the number of animals euthanized has increased over the period 1985-2004,with a significant increase between 1994 and 1996.
E) The distribution of the number of cats and dogs that were euthanized is skewed to the left,and has several modes,with gaps in between.One mode is clustered between 87,000 and 90,000 euthanized,a second mode at 84,000,and a third mode with a cluster between 81,000 and 82,000.The timeplot shows that the number of animals euthanized has increased over the period 1985-2004,with a significant increase between 1994 and 1996.
Correct Answer:

Verified
Correct Answer:
Verified
Q19: The following stem-and-leaf display shows the number
Q20: A business owner recorded her annual profits
Q21: The weights (in pounds)of 30 newborn babies
Q22: Here are some summary statistics for all
Q24: The weekly salaries (in dollars)of 24 randomly
Q25: The weekly salaries (in dollars)of sixteen government
Q26: Here are the highest temperatures ever recorded
Q27: The test scores of 15 students are
Q28: The weekly salaries (in dollars)of 24 randomly
Q32: Which class had the highest mean score?<br>A)Class