Multiple Choice
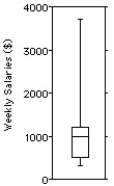
The weekly salaries (in dollars) of 24 randomly selected employees of a company are shown below. 
Choose the boxplot that represents the given data.
I II III 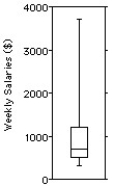

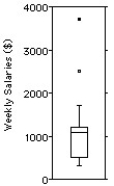
IV V 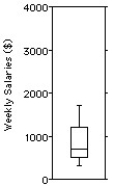
A) I
B) II
C) III
D) IV
E) V
Correct Answer:

Verified
Correct Answer:
Verified
Related Questions
Q23: The following stem-and-leaf display shows the number
Q24: The weekly salaries (in dollars)of 24 randomly
Q25: The weekly salaries (in dollars)of sixteen government
Q26: Here are the highest temperatures ever recorded
Q27: The test scores of 15 students are
Q29: Use the high closing values of Naristar
Q30: Shown below are the boxplot,the histogram and
Q31: Shown below are the boxplot and the
Q32: Here are summary statistics for the time,in
Q33: The normal monthly precipitation (in inches)for August