Multiple Choice
Assume that the conductivity of a solution depends only on the total concentration of dissolved ions and that you measure the conductivity of three different solutions while performing titrations in which
I.50.00 mL of 0.100 M aqueous CH3CO2H is titrated by addition of 0.100 M NaOH.
II.50.00 mL of 0.100 M aqueous NaBr is titrated by addition of 0.100 M AgNO3.
III.50.00 mL of 0.100 M aqueous CaCl2 is titrated by addition of 0.100 M Na2CO3. 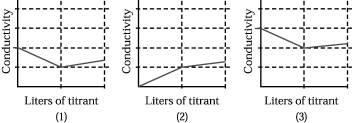
-Which of the above graphs corresponds to titration I?
A) graph (1)
B) graph (2)
C) graph (3)
D) None of the graphs
Correct Answer:

Verified
Correct Answer:
Verified
Q145: A student prepared a stock solution by
Q146: Which of the following is not a
Q147: Predict the products of a reaction between
Q148: When 50.0 mL of a 1.00 M
Q149: <img src="https://d2lvgg3v3hfg70.cloudfront.net/TB4940/.jpg" alt=" -The concentration of
Q151: The compound K<sub>2</sub>CO<sub>3</sub> is predicted to be
Q152: Write a net ionic equation for the
Q153: Which one of the following compounds is
Q154: Ascorbic acid,C<sub>6</sub>H<sub>8</sub>0<sub>6</sub>,can be represented by the molecular
Q155: Because it forms some H<sup>+</sup> and OCl<sup>-</sup>