Multiple Choice
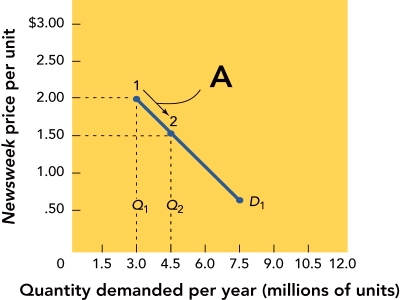 Figure 13-5A
-Figure 13-5A above shows that when the quantity demanded moves from 3.0 to 4.5 million units along the demand curve D1,the profit
A) increases from $1.50 to $2.00 per unit.
B) decreases from $2.00 to $1.50 per unit.
C) stays the same per unit.
D) increases from $0.50 to $1.50 per unit.
E) Figure 13-5A does not indicate what happens to profit when the quantity demanded changes.
Correct Answer:

Verified
Correct Answer:
Verified
Q41: While pricing objectives frequently reflect corporate goals,
Q42: Which of the following are examples of
Q57: Washburn sells their guitars through a number
Q58: the CEO of the Clorox Company were
Q60: demand curve graph typically appears as<br>A) a
Q62: Which of the following statements is most
Q63: volume as a pricing objective refers to<br>A)
Q65: Estimating cost, conducting a marginal analysis, and
Q66: a price of $3.00 each,SHAPE magazine sells
Q118: According to the price equation,final price equals