Multiple Choice
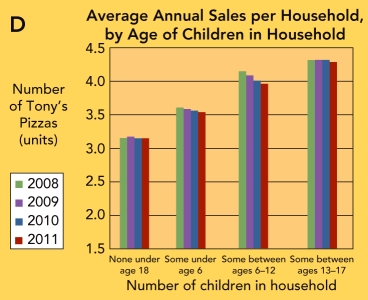 Figure 8-6D: Average Annual Sales per Household of Tony's Pizza,
by Age of Children in Household
-Figure 8-6D above shows that
A) Tony's Pizza sales to households with some children between the ages of 13 to 17 decreased significantly over the period 2008 to 2011.
B) Tony's Pizza unit sales to households with children between the ages of 6 to 12 decreased over the period 2008 to 2011.
C) Tony's Pizza sales to single-person households have remained relatively steady from 2008 to 2011.
D) Tony's Pizza sales to households with no children under 18 have declined from 2008 to 2011.
E) there is not a significant enough difference between age groups that would warrant a marketing action at this time.
Correct Answer:

Verified
Correct Answer:
Verified
Q24: <img src="https://d2lvgg3v3hfg70.cloudfront.net/TB1242/.jpg" alt=" Figure 8-5 -Figure
Q173: Based on the Fisher-Price Chatter Telephone example
Q174: percentage of sales forecasts is made by
Q176: Marketing drivers are used with which of
Q177: National Health Interview Survey is conducted annually
Q179: <img src="https://d2lvgg3v3hfg70.cloudfront.net/TB2495/.jpg" alt=" Marketing Research Method
Q180: <img src="https://d2lvgg3v3hfg70.cloudfront.net/TB2495/.jpg" alt=" Fisher-Price Photo -the
Q181: National TV ratings,published by the Nielsen Company,are
Q182: <img src="https://d2lvgg3v3hfg70.cloudfront.net/TB2495/.jpg" alt=" Figure 8-3 -Figure
Q183: advantage of using a panel of consumers