Multiple Choice
The accompanying chart shows the numbers of books written by each author in a collection of cookbooks. What type of chart is this? 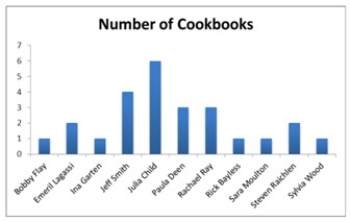
A) Bar chart for qualitative data
B) Bar chart for quantitative data
C) Frequency histogram for qualitative data
D) Frequency histogram for quantitative data
Correct Answer:

Verified
Correct Answer:
Verified
Q1: The accompanying relative frequency distribution represents the
Q3: <img src="https://d2lvgg3v3hfg70.cloudfront.net/TB6618/.jpg" alt=" Using a scatterplot
Q4: Construct a stem-and-leaf diagram for the following
Q5: Thirty students at Eastside High School took
Q6: In the following pie chart representing a
Q7: The following table shows the percentage of
Q8: The following table shows analyst sentiment ratings
Q9: A scatterplot is a graphical tool that
Q10: A city in California spent $6 million
Q11: The accompanying chart shows the number of