Multiple Choice
The following scatterplot shows productivity and number hired workers with a fitted quadratic regression model. 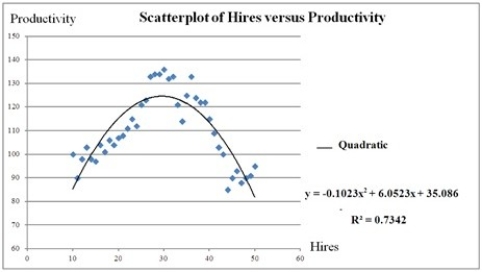 What is percentage of the variation in productivity is explained by the quadratic regression model?
A) 85.69%
B) 0.7342%
C) 90.54%
D) 73.42%
Correct Answer:

Verified
Correct Answer:
Verified
Q91: The regression model ln(y) = β<sub>0</sub> +
Q92: For which of the following models is
Q93: The following scatterplot shows productivity and number
Q94: The following scatterplot shows productivity and number
Q95: The cubic regression model <img src="https://d2lvgg3v3hfg70.cloudfront.net/TB6618/.jpg" alt="The
Q97: The quadratic regression model <img src="https://d2lvgg3v3hfg70.cloudfront.net/TB6618/.jpg" alt="The
Q98: Which of the following nonlinear regression models
Q99: What does a positive value for price
Q100: What is the effect of b<sub>2</sub> <
Q101: For the quadratic regression model <img src="https://d2lvgg3v3hfg70.cloudfront.net/TB6618/.jpg"