Multiple Choice
The following scatterplot shows productivity and number hired workers with a fitted quadratic regression model. 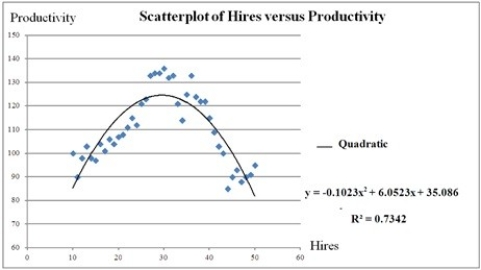 The quadratic regression model is ________.
A)  = 35.086 + 6.0523Hires - 0.1023Hires2
B)
 = 6.0523 + 35.086Hires - 0.1023Hires2
C)
 = 6.0523 − 35.086Hires + 0.1023Hires2
D)
 = −0.1023 + 6.0523Hires + 35.086Hires2
Correct Answer:

Verified
Correct Answer:
Verified
Q89: Thirty employed single individuals were randomly selected
Q90: The following data, with the corresponding Excel
Q91: The regression model ln(y) = β<sub>0</sub> +
Q92: For which of the following models is
Q93: The following scatterplot shows productivity and number
Q95: The cubic regression model <img src="https://d2lvgg3v3hfg70.cloudfront.net/TB6618/.jpg" alt="The
Q96: The following scatterplot shows productivity and number
Q97: The quadratic regression model <img src="https://d2lvgg3v3hfg70.cloudfront.net/TB6618/.jpg" alt="The
Q98: Which of the following nonlinear regression models
Q99: What does a positive value for price