Multiple Choice
The following scatterplot shows productivity and number hired workers with a fitted quadratic regression model. 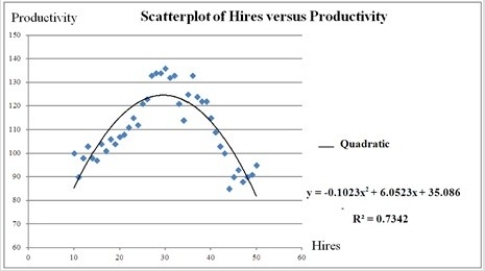 Assuming that the values of Hires can be nonintegers, what is the maximum value of Productivity predicted by the model?
A) 29.58
B) 124.603
C) 35.086
D) 127.50
Correct Answer:

Verified
Correct Answer:
Verified
Q88: The following data show the demand for
Q89: Thirty employed single individuals were randomly selected
Q90: The following data, with the corresponding Excel
Q91: The regression model ln(y) = β<sub>0</sub> +
Q92: For which of the following models is
Q94: The following scatterplot shows productivity and number
Q95: The cubic regression model <img src="https://d2lvgg3v3hfg70.cloudfront.net/TB6618/.jpg" alt="The
Q96: The following scatterplot shows productivity and number
Q97: The quadratic regression model <img src="https://d2lvgg3v3hfg70.cloudfront.net/TB6618/.jpg" alt="The
Q98: Which of the following nonlinear regression models