Multiple Choice
The following scatterplot shows productivity and number hired workers with a fitted quadratic regression model. 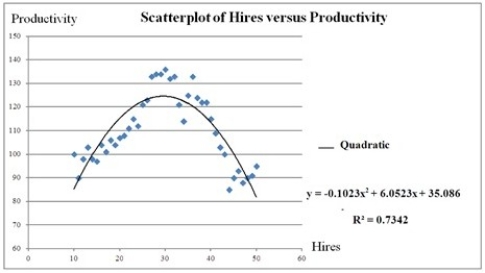 For which value of Hires is the predicted Productivity maximized? Note: Do not round to the nearest integer.
A) 29.58
B) 124.60
C) 35.086
D) 27.34
Correct Answer:

Verified
Correct Answer:
Verified
Q107: The following data show the demand for
Q108: In the model ln(y) = β<sub>0</sub> +
Q109: Typically, the sales volume declines with an
Q110: The following data, with the corresponding Excel
Q111: It is believed that the sales volume
Q113: Thirty employed single individuals were randomly selected
Q114: The log-log and exponential models, ln(x) =
Q115: When not all variables are transformed with
Q116: The following scatterplot shows productivity and number
Q117: The following scatterplot shows productivity and number