Multiple Choice
Typically, the sales volume declines with an increase of a product price. It has been observed, however, that for some luxury goods the sales volume may increase when the price increases. The following scatterplot illustrates this rather unusual relationship. 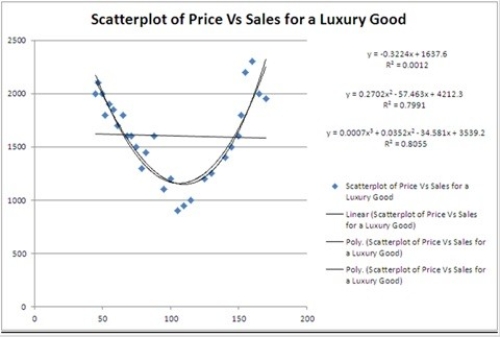 Which of the following models is most likely to be chosen in order to describe the relationship between Price and Sales?
A) Linear
B) Quadratic
C) Cubic
D) Exponential
Correct Answer:

Verified
Correct Answer:
Verified
Q104: Thirty employed single individuals were randomly selected
Q105: The regression model ln(y) = β<sub>0</sub> +
Q106: For the log-log model ln(y) = β<sub>0</sub>
Q107: The following data show the demand for
Q108: In the model ln(y) = β<sub>0</sub> +
Q110: The following data, with the corresponding Excel
Q111: It is believed that the sales volume
Q112: The following scatterplot shows productivity and number
Q113: Thirty employed single individuals were randomly selected
Q114: The log-log and exponential models, ln(x) =