Multiple Choice
The following data, with the corresponding Excel scatterplot, show the average growth rate of Weeping Higan cherry trees planted in Washington, DC. At the time of planting, the trees were one year old and were all six feet in height. 
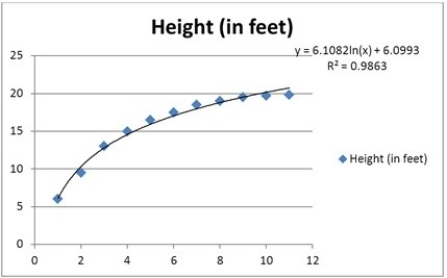 What percent of the variation in heights is explained by the model? ________.
A) 6.09
B) 6.10
C) 98.63
D) Can't determine from the given information
Correct Answer:

Verified
Correct Answer:
Verified
Q85: The coefficient of determination R<sup>2</sup> cannot be
Q86: When the predicted value of the response
Q87: Typically, the sales volume declines with an
Q88: The following data show the demand for
Q89: Thirty employed single individuals were randomly selected
Q91: The regression model ln(y) = β<sub>0</sub> +
Q92: For which of the following models is
Q93: The following scatterplot shows productivity and number
Q94: The following scatterplot shows productivity and number
Q95: The cubic regression model <img src="https://d2lvgg3v3hfg70.cloudfront.net/TB6618/.jpg" alt="The