Multiple Choice
The following data show the demand for an airline ticket dependent on the price of this ticket. 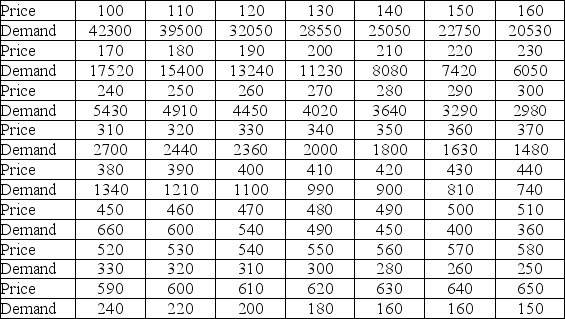 For the assumed cubic and log-log regression models, Demand = β0 + β1Price + β2Price2 + β3Price3 + ε and ln(Demand) = β0 + β1ln(Price) + ε, the following regression results are available.
  Which of the following is the percentage of variation in ln(Demand) explained by the log-log regression model?
A) 98.52%
B) 98.50%
C) 91.39%
D) 97.93%
Correct Answer:

Verified
Correct Answer:
Verified
Q28: It is believed that the sales volume
Q29: The following data show the cooling temperatures
Q30: The scatterplot shown below represents a typical
Q31: The following data show the cooling temperatures
Q32: Thirty employed single individuals were randomly selected
Q34: The following data show the cooling temperatures
Q35: Typically, the sales volume declines with an
Q36: The quadratic and logarithmic models, y =
Q37: The following data show the cooling temperatures
Q38: The following data show the cooling temperatures