Multiple Choice
The following data show the cooling temperatures of a freshly brewed cup of coffee after it is poured from the brewing pot into a serving cup. The brewing pot temperature is approximately 180º F. 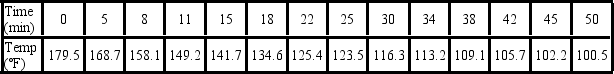 The output for an exponential model ln(Temp) = β0 + β1Time + ε, t is below.
  Which of the following is the percentage of variation in ln(Temp) explained by the model?
A) 45.48%
B) 97.01%
C) 1.40%
D) 46.88%
Correct Answer:

Verified
Correct Answer:
Verified
Q32: Thirty employed single individuals were randomly selected
Q33: The following data show the demand for
Q34: The following data show the cooling temperatures
Q35: Typically, the sales volume declines with an
Q36: The quadratic and logarithmic models, y =
Q38: The following data show the cooling temperatures
Q39: The following data show the demand for
Q40: Thirty employed single individuals were randomly selected
Q41: Typically, the sales volume declines with an
Q42: The following data show the cooling temperatures