Multiple Choice
The following data show the demand for an airline ticket dependent on the price of this ticket. 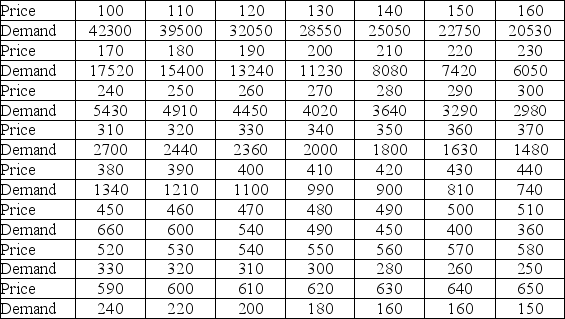 For the assumed cubic and log-log regression models, Demand = β0 + β1Price + β2Price2 + β3Price3 + ε and ln(Demand) = β0 + β1ln(Price) + ε, the following regression results are available.
  Assuming that the sample correlation coefficient between Demand and
  = exp(26.3660 - 3.2577 ln(Price) + (0.2071) 2/2) is 0.956, what is the percentage of variations in Demand explained by the log-log regression model?
A) 98.52%
B) 98.50%
C) 91.39%
D) 97.93%
Correct Answer:

Verified
Correct Answer:
Verified
Q34: The following data show the cooling temperatures
Q35: Typically, the sales volume declines with an
Q36: The quadratic and logarithmic models, y =
Q37: The following data show the cooling temperatures
Q38: The following data show the cooling temperatures
Q40: Thirty employed single individuals were randomly selected
Q41: Typically, the sales volume declines with an
Q42: The following data show the cooling temperatures
Q43: A model with one explanatory variable that
Q44: For the logarithmic model y = β<sub>0</sub>