Short Answer
The graph in the figure shows the position of a particle as a function of time as it travels along the x-axis.
(a) What is the average speed of the particle between t = 2.0 s and t = 4.0 s?
(b) What is the average velocity of the particle between t = 2.0 s and t = 4.0 s? 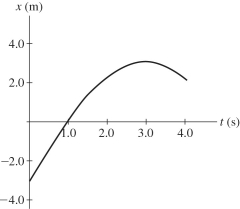
Correct Answer:

Verified
(a) 1.0 m/...View Answer
Unlock this answer now
Get Access to more Verified Answers free of charge
Correct Answer:
Verified
View Answer
Unlock this answer now
Get Access to more Verified Answers free of charge
Q33: The slope of a position versus time
Q34: Under what condition is average velocity equal
Q45: An object is moving with constant non-zero
Q52: Suppose that a car traveling to the
Q76: The figure shows a graph of the
Q78: The graph in the figure shows the
Q79: A soccer ball is released from rest
Q81: The captain orders his starship to accelerate
Q129: To determine the height of a bridge
Q292: A ball is thrown straight up with