Multiple Choice
The graph in the figure shows the position of a particle as it travels along the x-axis. What is the magnitude of the average velocity of the particle between t = 1.0 s and t = 4.0 s? 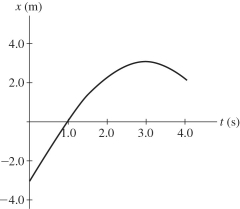
A) 0.25 m/s
B) 0.50 m/s
C) 0.67 m/s
D) 1.0 m/s
E) 1.3 m/s
Correct Answer:

Verified
Correct Answer:
Verified
Related Questions
Q33: The slope of a position versus time
Q39: A motorist travels 160 km at 80
Q52: Suppose that a car traveling to the
Q76: The figure shows a graph of the
Q79: A soccer ball is released from rest
Q80: The graph in the figure shows the
Q81: The captain orders his starship to accelerate
Q88: A motorist travels for 3.0 h at
Q129: To determine the height of a bridge
Q292: A ball is thrown straight up with