Multiple Choice
The process shown in the T-V diagram in the figure is an 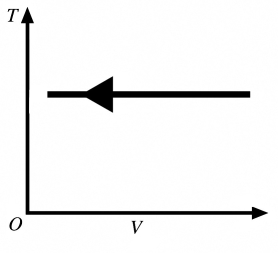
A) adiabatic compression.
B) isothermal compression.
C) isochoric compression.
D) isobaric compression.
E) isothermal expansion.
Correct Answer:

Verified
Correct Answer:
Verified
Related Questions
Q28: When a gas undergoes an isothermal process,there
Q29: The figure shows the pV diagram for
Q30: The figure shows a pV diagram for
Q31: A certain amount of ideal monatomic gas
Q32: An adiabatic compression is performed on an
Q34: An ideal gas is compressed in a
Q35: The temperature of an ideal gas in
Q36: In an isochoric process,the internal (thermal)energy of
Q37: The figure shows a pV diagram for
Q38: The pV diagram shown is for 7.50