Multiple Choice
The figure shows a pV diagram for 0.0066 mol of gas that undergoes the process 1 → 2 → 3.What is the pressure p2.The ideal gas constant is R = 8.314 J/mol • K = 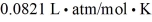 .
. 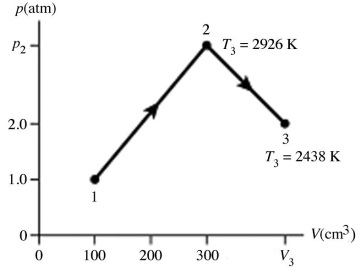
A) 5.3 atm
B) 5.3 × 10⁵ atm
C) 16 atm
D) 1.6 × 10⁶ atm
Correct Answer:

Verified
Correct Answer:
Verified
Related Questions
Q25: The figure (not to scale)shows a pV
Q26: An ideal gas is allowed to expand
Q27: A container with rigid walls is filled
Q28: When a gas undergoes an isothermal process,there
Q29: The figure shows the pV diagram for
Q31: A certain amount of ideal monatomic gas
Q32: An adiabatic compression is performed on an
Q33: The process shown in the T-V diagram
Q34: An ideal gas is compressed in a
Q35: The temperature of an ideal gas in