Multiple Choice
The process shown in the pV diagram in the figure is 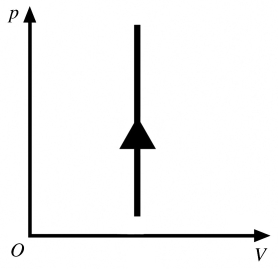
A) adiabatic.
B) isothermal.
C) isochoric.
D) isobaric.
Correct Answer:

Verified
Correct Answer:
Verified
Related Questions
Q18: An ideal gas increases in temperature from
Q19: 3.0 moles of an ideal gas with
Q20: A cylinder contains 1.2 moles of ideal
Q21: A cylinder contains 24.0 moles of an
Q22: The figure shows a pV diagram for
Q24: When an ideal gas increases in volume
Q25: The figure (not to scale)shows a pV
Q26: An ideal gas is allowed to expand
Q27: A container with rigid walls is filled
Q28: When a gas undergoes an isothermal process,there