Multiple Choice
Figure 4.2 shows the demand curves for a good.A shift from demand curve D to demand curve D' in the figure would be caused by a(n) : Figure 4.2
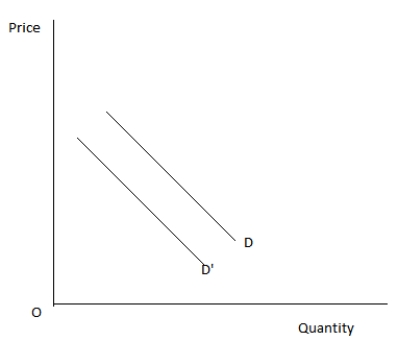
A) decrease in the price of the good under consideration.
B) significant increase in population because of immigration.
C) decrease in consumer income.
D) decrease in the number of producers of the product.
E) increase in the price of an important resource.
Correct Answer:

Verified
Correct Answer:
Verified
Q8: The table given below shows the quantity
Q10: What is the effect of a decrease
Q10: Figure 4.5 shows the supply curves of
Q77: Which of these is likely to increase
Q89: If the price of potato chips increases,other
Q96: The income effect of a decrease in
Q104: Markets tend to increase the costs of
Q105: Which of the following will lead to
Q107: If butter and margarine are substitute goods,an
Q138: As the price of milk increases,producers are