Multiple Choice
The figure shows the determination of thr equilibrium price level and real GDP in an aggregate demand-aggregate supply model.Which of the following economic changes is depicted by a movement from point e to point e'?
Figure 10.6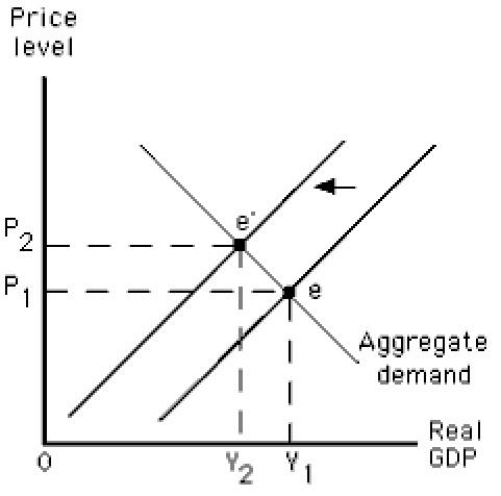
A) An increase in short-run aggregate supply
B) An increase in long-run aggregate supply
C) A decrease in short-run aggregate supply
D) A decrease in long-run aggregate supply
E) An increase in the aggregate quantity demanded
Correct Answer:

Verified
Correct Answer:
Verified
Q18: The potential output of an economy is:<br>A)the
Q45: Suppose the real wage remains unchanged between
Q51: When the economy is at its potential
Q58: Which of the following is most likely
Q72: Which of the following is true in
Q106: An increase in aggregate demand in the
Q123: Which of the following is most likely
Q132: Which of the following is true of
Q143: The figure below shows the short-run aggregate
Q149: Which of the following supply shocks will