True/False
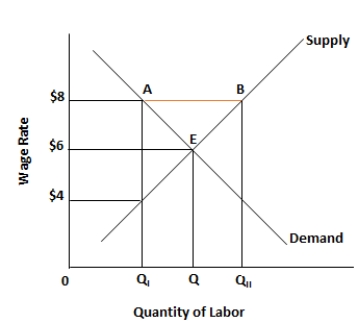
Figure 5.3. The figure shows the wage rate and the quantity of labor supplied in an unskilled labor market. 
-The production possibilities curve of a low income country lies outside the production possibilities curve of a high income country.
Correct Answer:

Verified
Correct Answer:
Verified
Related Questions
Q47: Figure 5.3. The figure shows the wage
Q48: Scenario 4-1<br>In a given year, country A
Q49: Figure 5.2. The figure shows the supply
Q50: Figure 5.3. The figure shows the wage
Q51: Figure 5.3. The figure shows the wage
Q53: Figure 5.3. The figure shows the wage
Q54: Figure 5.2. The figure shows the supply
Q55: Figure 5.3. The figure shows the wage
Q56: Figure 5.1. The figure shows a linear
Q57: Figure 5.3. The figure shows the wage