Multiple Choice
Figure 5.2. The figure shows the supply and demand curves of a firm. 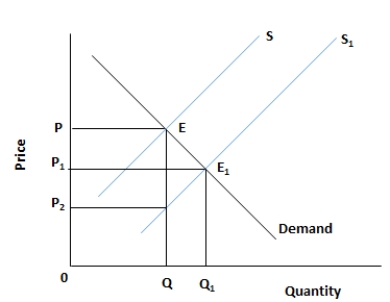
-Refer to figure 5.2. Which of the following will cause a shift in the supply curve from S to S1?
A) A decline in the cost of producing the commodity
B) An increase in the cost of producing the commodity
C) An increase in the price of the commodity
D) A decline in the price of the commodity
E) A leftward shift in the demand curve of the product
Correct Answer:

Verified
Correct Answer:
Verified
Q49: Figure 5.2. The figure shows the supply
Q50: Figure 5.3. The figure shows the wage
Q51: Figure 5.3. The figure shows the wage
Q52: Figure 5.3. The figure shows the wage
Q53: Figure 5.3. The figure shows the wage
Q55: Figure 5.3. The figure shows the wage
Q56: Figure 5.1. The figure shows a linear
Q57: Figure 5.3. The figure shows the wage
Q58: Figure 5.1. The figure shows a linear
Q59: Figure 5.2. The figure shows the supply