menu-iconExamlexExamLexServices

Discover

Ask a Question
  1. All Topics
  2. Topic
    Business
  3. Study Set
    Microeconomics Study Set 17
  4. Exam
    Exam 5: Using Economics to Understand the World Around You
  5. Question
    ​Figure 53
Solved

​Figure 53

Question 53

Question 53

True/False

​Figure 5.3. The figure shows the wage rate and the quantity of labor supplied in an unskilled labor market. ​Figure 5.3. The figure shows the wage rate and the quantity of labor supplied in an unskilled labor market.   -Minimum wage adversely affects unskilled workers who do not have work, aged 16 to 19.
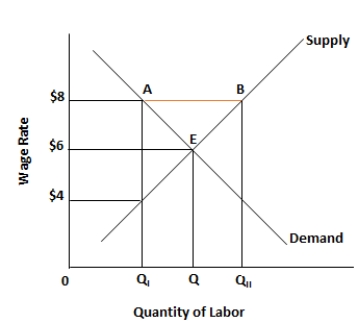
-Minimum wage adversely affects unskilled workers who do not have work, aged 16 to 19.

Correct Answer:

verifed

Verified

Unlock this answer now
Get Access to more Verified Answers free of charge

Related Questions

Q48: Scenario 4-1<br>In a given year, country A

Q49: ​Figure 5.2. The figure shows the supply

Q50: ​Figure 5.3. The figure shows the wage

Q51: ​Figure 5.3. The figure shows the wage

Q52: ​Figure 5.3. The figure shows the wage

Q54: ​Figure 5.2. The figure shows the supply

Q55: ​Figure 5.3. The figure shows the wage

Q56: Figure 5.1. The figure shows a linear

Q57: ​Figure 5.3. The figure shows the wage

Q58: Figure 5.1. The figure shows a linear

Examlex

ExamLex

About UsContact UsPerks CenterHomeschoolingTest Prep

Work With Us

Campus RepresentativeInfluencers

Links

FaqPricingChrome Extension

Download The App

Get App StoreGet Google Play

Policies

Privacy PolicyTerms of ServiceHonor CodeCommunity Guidelines

Scan To Download

qr-code

Copyright © (2025) ExamLex LLC.

Privacy PolicyTerms Of ServiceHonor CodeCommunity Guidelines