True/False
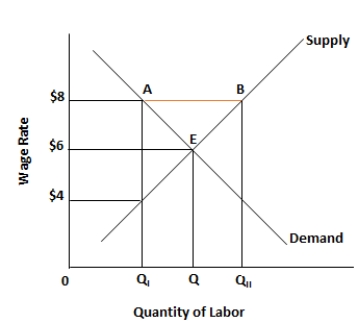
Figure 5.3. The figure shows the wage rate and the quantity of labor supplied in an unskilled labor market. 
-People are compelled to make a choice because of the lack of time and money to buy everything they want.
Correct Answer:

Verified
Correct Answer:
Verified
Related Questions
Q55: Figure 5.3. The figure shows the wage
Q56: Figure 5.1. The figure shows a linear
Q57: Figure 5.3. The figure shows the wage
Q58: Figure 5.1. The figure shows a linear
Q59: Figure 5.2. The figure shows the supply
Q61: Figure 5.3. The figure shows the wage
Q62: Figure 5.3. The figure shows the wage
Q63: Figure 5.2. The figure shows the supply
Q64: Figure 5.2. The figure shows the supply
Q65: Figure 5.3. The figure shows the wage