True/False
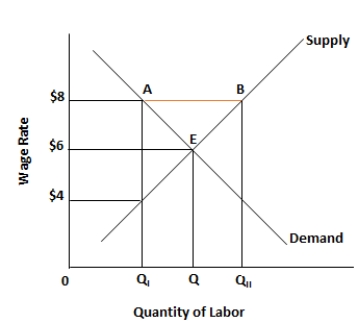
Figure 5.3. The figure shows the wage rate and the quantity of labor supplied in an unskilled labor market. 
-The imposition of a minimum wage in the unskilled labor market creates labor surplus or unemployment.
Correct Answer:

Verified
Correct Answer:
Verified
Related Questions
Q57: Figure 5.3. The figure shows the wage
Q58: Figure 5.1. The figure shows a linear
Q59: Figure 5.2. The figure shows the supply
Q60: Figure 5.3. The figure shows the wage
Q61: Figure 5.3. The figure shows the wage
Q63: Figure 5.2. The figure shows the supply
Q64: Figure 5.2. The figure shows the supply
Q65: Figure 5.3. The figure shows the wage
Q66: Figure 5.2. The figure shows the supply
Q67: Figure 5.1. The figure shows a linear