Multiple Choice
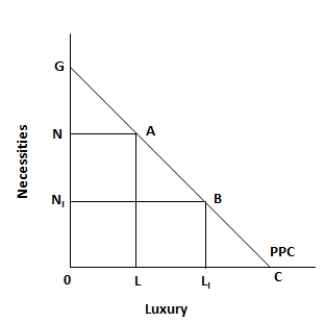
Figure 5.1. The figure shows a linear production possibility curve representing a tradeoff faced by a country, between necessities and luxuries. 
-Individuals acting with self-interest:
A) always choose the same options as other rational individuals.
B) never do voluntary work.
C) always try to attain satisfaction at the expense of others.
D) choose options that give them the greatest amount of satisfaction.
E) have a perfectly elastic demand curve.
Correct Answer:

Verified
Correct Answer:
Verified
Q53: Figure 5.3. The figure shows the wage
Q54: Figure 5.2. The figure shows the supply
Q55: Figure 5.3. The figure shows the wage
Q56: Figure 5.1. The figure shows a linear
Q57: Figure 5.3. The figure shows the wage
Q59: Figure 5.2. The figure shows the supply
Q60: Figure 5.3. The figure shows the wage
Q61: Figure 5.3. The figure shows the wage
Q62: Figure 5.3. The figure shows the wage
Q63: Figure 5.2. The figure shows the supply