Multiple Choice
The below indifference map shows the various combinations of hours of music and apples that yield different levels of utility.Figure 7.1
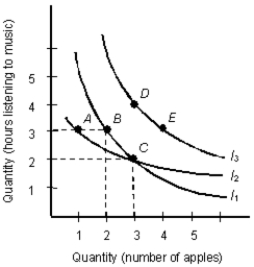
-According to indifference curve I1 in Figure 7.1, for each extra apple the consumer eats, he or she must simultaneously sacrifice ____ of listening to music to keep total utility constant.
A) 1 hour
B) 2 hours
C) 3 hours
D) 4 hours
E) 5 hours
Correct Answer:

Verified
Correct Answer:
Verified
Q2: Scenario 5.1<br>The demand for noodles is given
Q3: The table below shows the total utility
Q4: The table below shows the total utility
Q5: The below table shows the average utility
Q6: The below figure shows the various combinations
Q8: The table below shows the total utility
Q9: The figure given below represents two indifference
Q10: The table given below records the total
Q11: The below figure shows the various combinations
Q12: Scenario 5.1<br>The demand for noodles is given