Multiple Choice
The figure given below represents two indifference curves I1 and I2 of an individual.Figure 7.2
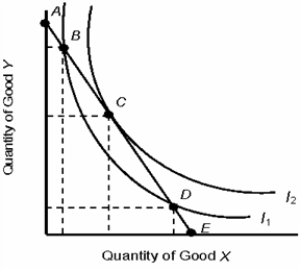
-Refer to Figure 7.2. Which of the following statements is true?
A) Point B yields a greater level of satisfaction than point D.
B) Points A and E yield the same level of satisfaction.
C) Point B yields a greater level of satisfaction than point C.
D) I2 represents a greater level of satisfaction than I1.
E) Point C yields a lower level of satisfaction than point D.
Correct Answer:

Verified
Correct Answer:
Verified
Q4: The table below shows the total utility
Q5: The below table shows the average utility
Q6: The below figure shows the various combinations
Q7: The below indifference map shows the various
Q8: The table below shows the total utility
Q10: The table given below records the total
Q11: The below figure shows the various combinations
Q12: Scenario 5.1<br>The demand for noodles is given
Q13: The below table shows the average utility
Q14: The below figure shows the various combinations