Multiple Choice
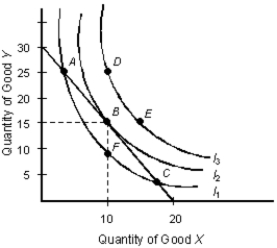
The below figure shows the various combinations of the goods X and Y that yield different levels of utility.Figure 7.3

-Refer to Figure 7.3. What combinations of X and Y are attainable by the consumer?
A) All combinations that lie on or above I2
B) All combinations that lie above I1
C) All combinations that lie below I3
D) All combinations that lie on or below the budget line.
E) Only the combination of 10 units of good X and 15 units of good Y
Correct Answer:

Verified
Correct Answer:
Verified
Q1: The below table shows the average utility
Q2: Scenario 5.1<br>The demand for noodles is given
Q3: The table below shows the total utility
Q4: The table below shows the total utility
Q5: The below table shows the average utility
Q7: The below indifference map shows the various
Q8: The table below shows the total utility
Q9: The figure given below represents two indifference
Q10: The table given below records the total
Q11: The below figure shows the various combinations