Multiple Choice
The figure given below shows the cost curves of a firm.Figure 9.3
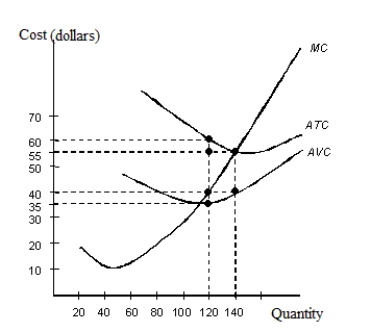 ATC: Average Total Cost
AVC: Average Variable Cost
MC: Marginal Cost
-In Figure 9.3, if the marginal revenue of the firm is constant at $55, calculate the profit earned by the firm at the profit-maximizing level of output?
A) $35
B) $40
C) $600
D) $4,800
E) $0
Correct Answer:

Verified
Correct Answer:
Verified
Q29: The figure given below shows the revenue
Q30: Scenario 9.2<br>Consider a publicly held firm (one
Q31: The figure given below shows three Short
Q32: Scenario 9.2<br>Consider a publicly held firm (one
Q33: The figure given below shows the revenue
Q35: The following figure shows the cost and
Q36: The following graph shows the demand and
Q37: The figure given below shows the revenue
Q38: Scenario 9.2<br>Consider a publicly held firm (one
Q39: The figure given below shows the revenue