Multiple Choice
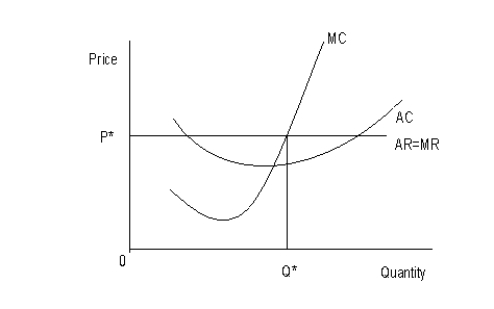
The following figure shows the cost and revenue structures of a firm. MC represents the marginal cost curve, AC represents the average cost curve, AR represents the average revenue curve, and MR represents the marginal revenue curve. P* is the equilibrium price and Q* is the equilibrium output.Figure 9.5
-The opportunity cost of capital is:
A) the cost of labor inputs required to operate that capital.
B) the cost of raw materials necessary to put that capital to work.
C) the payment necessary to keep that capital from moving to an alternative use.
D) the costs of maintenance necessary to keep that capital operating.
E) the cost of hiring more units of capital to generate additional units of output.
Correct Answer:

Verified
Correct Answer:
Verified
Q30: Scenario 9.2<br>Consider a publicly held firm (one
Q31: The figure given below shows three Short
Q32: Scenario 9.2<br>Consider a publicly held firm (one
Q33: The figure given below shows the revenue
Q34: The figure given below shows the cost
Q36: The following graph shows the demand and
Q37: The figure given below shows the revenue
Q38: Scenario 9.2<br>Consider a publicly held firm (one
Q39: The figure given below shows the revenue
Q40: Scenario 9.2<br>Consider a publicly held firm (one