Multiple Choice
The following graph shows the demand and cost curves of an imperfectly competitive firm. MC and ATC represent the marginal cost curve and the average cost curve respectively.Figure 9.1
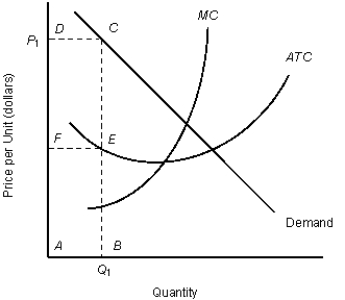
-According to Figure 9.1, what is the firm's profit when it sells quantity Q1 at price P1?
A) Rectangle ABCD
B) Rectangle DCEF
C) Rectangle ABEF
D) Distance AB
E) Distance FD
Correct Answer:

Verified
Correct Answer:
Verified
Q31: The figure given below shows three Short
Q32: Scenario 9.2<br>Consider a publicly held firm (one
Q33: The figure given below shows the revenue
Q34: The figure given below shows the cost
Q35: The following figure shows the cost and
Q37: The figure given below shows the revenue
Q38: Scenario 9.2<br>Consider a publicly held firm (one
Q39: The figure given below shows the revenue
Q40: Scenario 9.2<br>Consider a publicly held firm (one
Q41: The figure given below shows the revenue