Multiple Choice
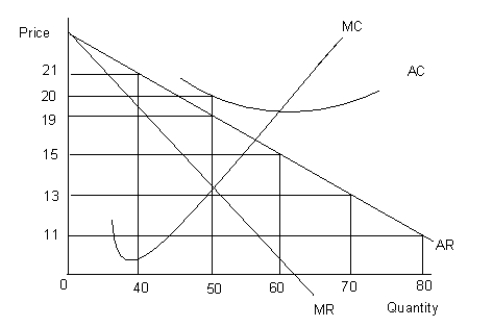
The figure given below shows the revenue and cost curves of a firm. MC represents the marginal cost curve, AC the average cost curve, MR the marginal revenue curve, and AR the average revenue curve.Figure 9.4

-In a perfectly competitive industry, the price of good A is $2. If a firm in this industry decides to increase its price to $2.50, it will:
A) realize an increase in profit of $0.50 per unit output.
B) be able to increase the quantity sold of good A.
C) be unable to sell any quantity of good A that is produced.
D) lose some of its customers in the market.
E) experience a decrease in profit of $0.50 per unit output.
Correct Answer:

Verified
Correct Answer:
Verified
Q45: The following graph shows the marginal revenue
Q46: The table given below reports the marginal
Q47: The following figure shows the cost and
Q48: The following table shows the annual income
Q49: The following table shows the annual income
Q51: The figure given below shows the revenue
Q52: Scenario 9.2<br>Consider a publicly held firm (one
Q53: Scenario 9.2<br>Consider a publicly held firm (one
Q54: Scenario 9.2<br>Consider a publicly held firm (one
Q55: The table given below reports the marginal