Multiple Choice
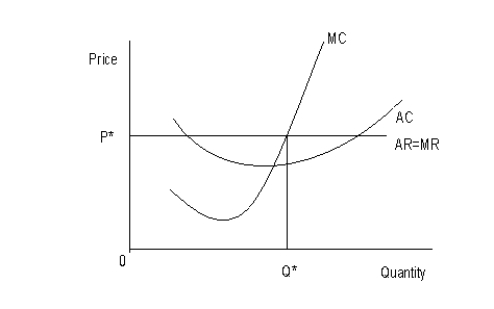
The following figure shows the cost and revenue structures of a firm. MC represents the marginal cost curve, AC represents the average cost curve, AR represents the average revenue curve, and MR represents the marginal revenue curve. P* is the equilibrium price and Q* is the equilibrium output.Figure 9.5
-The accounting profit of a business firm is also called:
A) royalty income.
B) net income from equity.
C) compensatory income.
D) windfall gain.
E) net operating income.
Correct Answer:

Verified
Correct Answer:
Verified
Q42: The figure given below shows the revenue
Q43: The following graph shows the demand and
Q44: The table given below reports the marginal
Q45: The following graph shows the marginal revenue
Q46: The table given below reports the marginal
Q48: The following table shows the annual income
Q49: The following table shows the annual income
Q50: The figure given below shows the revenue
Q51: The figure given below shows the revenue
Q52: Scenario 9.2<br>Consider a publicly held firm (one