Multiple Choice
The following graph shows the marginal revenue (MR) and marginal cost (MC) curves of an imperfectly competitive firm.Figure 9.2
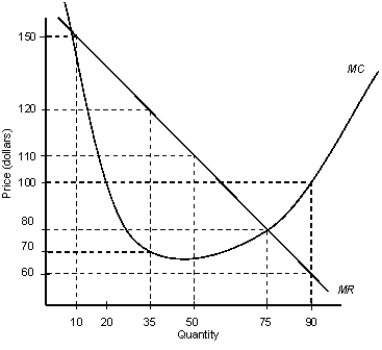
-Refer to Figure 9.2. If the current production level is 90 and the firm wishes to maximize profit, it should:
A) continue to produce at the current level.
B) decrease the quantity produced to 75.
C) decrease the quantity produced to 50.
D) decrease the quantity produced to 35.
E) increase production until MR = MC.
Correct Answer:

Verified
Correct Answer:
Verified
Q40: Scenario 9.2<br>Consider a publicly held firm (one
Q41: The figure given below shows the revenue
Q42: The figure given below shows the revenue
Q43: The following graph shows the demand and
Q44: The table given below reports the marginal
Q46: The table given below reports the marginal
Q47: The following figure shows the cost and
Q48: The following table shows the annual income
Q49: The following table shows the annual income
Q50: The figure given below shows the revenue