Multiple Choice
The table given below shows the price of each unit of the product manufactured by a firm and the marginal cost of producing different units of the output.Table: 10.1
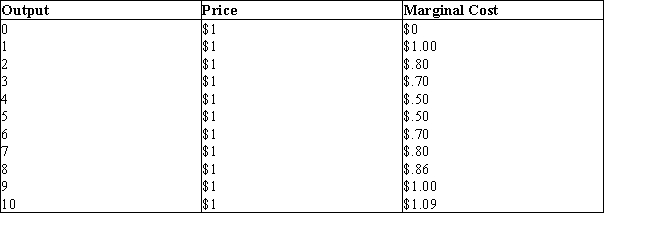
-Refer to Table 10.1. The firm depicted in the table is a(n) :
A) monopolist.
B) oligopolist.
C) monopolistically competitive firm.
D) perfectly competitive firm.
E) monopsonist.
Correct Answer:

Verified
Correct Answer:
Verified
Q53: The figure given below shows the aggregate
Q54: The following figure shows equilibrium at the
Q55: The following figure shows equilibrium at the
Q56: The following figure shows equilibrium at the
Q57: The table given below shows the total
Q59: The figure given below shows the revenue
Q60: The figure given below shows the revenue
Q61: Scenario 9.2<br>Consider a publicly held firm (one
Q62: Scenario 9.2<br>Consider a publicly held firm (one
Q63: The figure given below shows the revenue