Multiple Choice
The figure given below shows the revenue and cost curves of a perfectly competitive firm.Figure 10.1
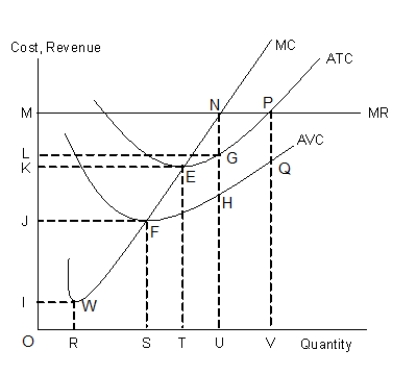
-In Figure 10.1, the firm maximizes its profit at _____ units of output.
A) OR
B) OS
C) OT
D) OU
E) OV
Correct Answer:

Verified
Correct Answer:
Verified
Related Questions
Q54: The following figure shows equilibrium at the
Q55: The following figure shows equilibrium at the
Q56: The following figure shows equilibrium at the
Q57: The table given below shows the total
Q58: The table given below shows the price
Q60: The figure given below shows the revenue
Q61: Scenario 9.2<br>Consider a publicly held firm (one
Q62: Scenario 9.2<br>Consider a publicly held firm (one
Q63: The figure given below shows the revenue
Q64: The figure given below shows the aggregate