Multiple Choice
The following figures show the demand and cost curves of a perfectly competitive firm and a monopoly respectively.Figure 11.7
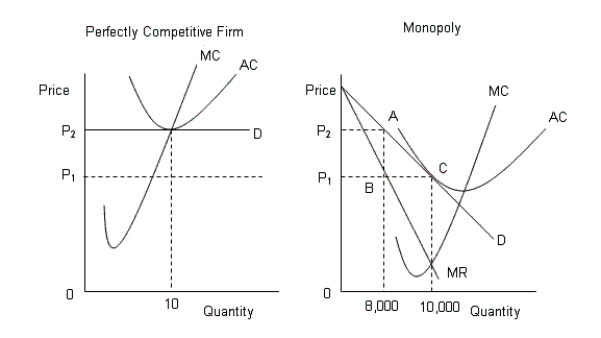 D: Average Revenue
AC: Average cost
MC: Marginal cost
MR: Marginal cost
-According to Figure 11.7, when the monopolist is maximizing profit:
A) its resources are not being used efficiently.
B) its price is higher than that charged by the perfectly competitive firm.
C) its price is equal to the price charged by the perfectly competitive firm.
D) a firm in perfect competition is earning above-normal profit.
E) a firm in perfect competition is incurring a loss.
Correct Answer:

Verified
Correct Answer:
Verified
Q13: The figure given below shows the cost
Q14: The figure below shows the market equilibrium
Q15: The figure given below shows the cost
Q16: The following figures show the demand and
Q17: The figures given below represent the revenue
Q19: The figures given below represent the revenue
Q20: The figures given below represent the revenue
Q21: The figure given below shows the cost
Q22: The figure given below shows the cost
Q23: The figure given below shows the aggregate