Multiple Choice
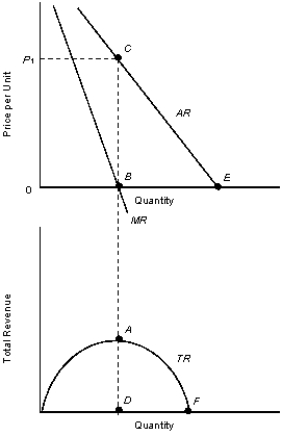
The figures given below represent the revenue curves of a monopolist.Figure 11.2
 TR: Total revenue curve
AR: Average revenue curve
MR: Marginal revenue curve
-Refer to Figure 11.2. If the monopolist is selling a quantity between B and E,then to maximize total revenue, the monopolist should:
A) increase price because it is operating on the elastic portion of the demand curve.
B) decrease price because it is operating on the elastic portion of the demand curve.
C) increase price because it is operating on the inelastic portion of the demand curve.
D) decrease price because it is operating on the inelastic portion of the demand curve.
E) increase price because it is operating at the point at which price elasticity of demand is greater than 1.
Correct Answer:

Verified
Correct Answer:
Verified
Q14: The figure below shows the market equilibrium
Q15: The figure given below shows the cost
Q16: The following figures show the demand and
Q17: The figures given below represent the revenue
Q18: The following figures show the demand and
Q20: The figures given below represent the revenue
Q21: The figure given below shows the cost
Q22: The figure given below shows the cost
Q23: The figure given below shows the aggregate
Q24: The table given below shows the price