Multiple Choice
The following figure shows the revenue curves of a monopolist:
Figure 11.6
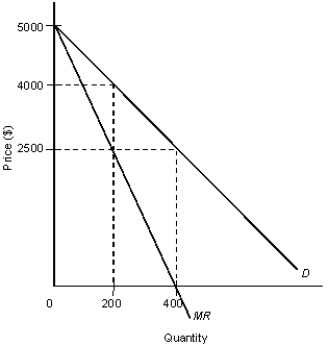 D: Average revenue
MR: Marginal revenue
-In Figure 11.6, assume that marginal costs are constant at $2,500 and fixed costs are zero. What price and output level would result from perfect competition?
A) P = $2,500, Q = 400
B) P = $2,500, Q = 200
C) P = $5,000, Q = 0
D) P = $4,000, Q = 400
E) P = $4,000, Q = 200
Correct Answer:

Verified
Correct Answer:
Verified
Q60: The figure given below shows the aggregate
Q61: The following table shows the units of
Q62: The figure given below shows the cost
Q63: The following figures show the demand and
Q64: The figure given below shows the cost
Q66: The table given below shows the price,
Q67: The figure given below shows the cost
Q68: The figure given below shows the cost
Q69: The table given below shows the price,
Q70: The figures given below represent the revenue